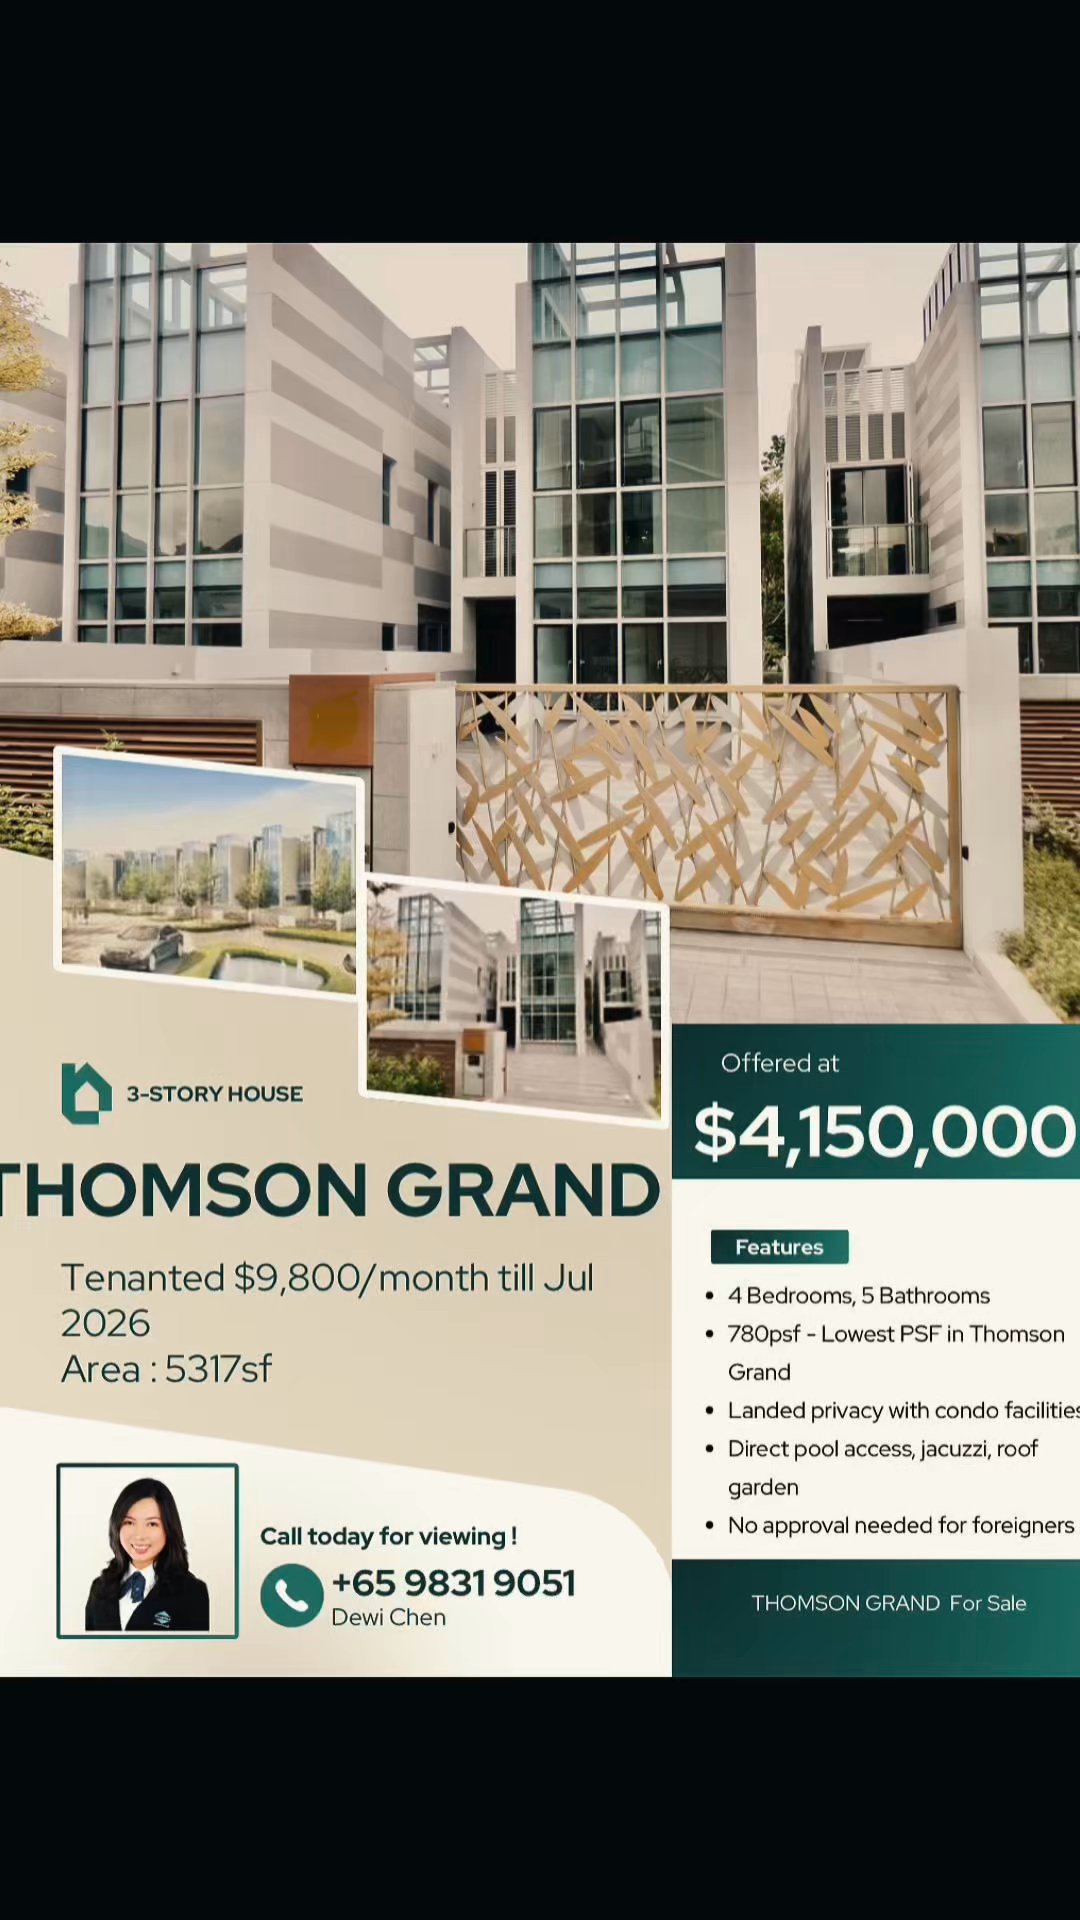
Sin Ming Walk, Upper Thomson, Central Region, Singapore
$4,150,000
Loading map...
Total Transactions
122
Average Price
S2.2M
Total Value
S266.3M
Calculating fair value from URA transaction data…
Disclaimer: The information provided on Listings.sg is for general informational purposes only. While we strive to ensure the accuracy of property listings, they are subject to change. If you notice any inaccuracies, fraudulent activity, or issues with this listing, please report it to our support team.
Automated Valuation based on 29 HDB resale transactions (data.gov.sg)
Fair Value
S$3.74M
S$704 psf
Asking Price
S$4.15M
S$781 psf
vs Market
+10.8%
vs Last Done
+38.0%
Tenure
88 yrs
99-year Leasehold · Balance remaining
Confidence
High
29 comps
Nearest MRT
Marymount
2130m away
URA PSF Trendline vs Listing Price
Hedonic Adjustment Breakdown
Base URA PSF
29 comparable transactions
S$671
Floor Premium
0.5% per floor vs median
+0.0%
Tenure Decay
Bala's curve (99yr leasehold)
×1.050
MRT Proximity
Within 500m / 1km
0%
AI Condition Premium
HELIOS scan of listing description
0%
Adjusted Fair Value PSF
S$704
Recent Comparable Transactions
10 shown · 29 total| Date | Block / Street | Area | Price | PSF | Tenure |
|---|---|---|---|---|---|
Last DoneAug 2025 | Blk 457 ANG MO KIO AVE 10 Floor 13 TO 15 | 1,765sqft | S$1,000,000 | ▼S$566 -19.6% vs FV | 99yr from 1980 |
Aug 2025 | Blk 457 ANG MO KIO AVE 10 Floor 13 TO 15 | 1,765sqft | S$1,000,000 | ▼S$566 -19.6% vs FV | 99yr from 1980 |
Aug 2024 | Blk 418 ANG MO KIO AVE 10 Floor 07 TO 09 | 1,755sqft | S$1,110,000 | ▼S$633 -10.1% vs FV | 99yr from 1979 |
Aug 2024 | Blk 419 ANG MO KIO AVE 10 Floor 10 TO 12 | 1,755sqft | S$1,238,888 | ▲S$706 +0.3% vs FV | 99yr from 1979 |
Aug 2024 | Blk 422 ANG MO KIO AVE 3 Floor 13 TO 15 | 1,873sqft | S$1,320,000 | ▲S$705 +0.1% vs FV | 99yr from 1979 |
Mar 2026 | Blk 605 ANG MO KIO AVE 5 Floor 07 TO 09 | 1,916sqft | S$1,350,000 | ▲S$705 +0.1% vs FV | 99yr from 1980 |
Mar 2026 | Blk 104A ANG MO KIO ST 11 Floor 01 TO 03 | 1,582sqft | S$1,225,000 | ▲S$774 +9.9% vs FV | 99yr from 1996 |
Jan 2026 | Blk 104A ANG MO KIO ST 11 Floor 01 TO 03 | 1,550sqft | S$1,201,888 | ▲S$775 +10.1% vs FV | 99yr from 1996 |
Sep 2025 | Blk 333 ANG MO KIO AVE 1 Floor 07 TO 09 | 1,755sqft | S$1,110,000 | ▼S$633 -10.1% vs FV | 99yr from 1981 |
Sep 2025 | Blk 613 ANG MO KIO AVE 4 Floor 07 TO 09 | 1,647sqft | S$1,128,000 | ▼S$685 -2.7% vs FV | 99yr from 1996 |
Sep 2025 | Blk 613 ANG MO KIO AVE 4 Floor 01 TO 03 | 1,679sqft | S$1,178,000 | ▼S$702 -0.3% vs FV | 99yr from 1996 |
Blk 457 ANG MO KIO AVE 10
Aug 2025 · Floor 13 TO 15
-19.6% vs FV
Blk 457 ANG MO KIO AVE 10
Aug 2025 · Floor 13 TO 15
-19.6% vs FV
Blk 418 ANG MO KIO AVE 10
Aug 2024 · Floor 07 TO 09
-10.1% vs FV
Blk 419 ANG MO KIO AVE 10
Aug 2024 · Floor 10 TO 12
+0.3% vs FV
Blk 422 ANG MO KIO AVE 3
Aug 2024 · Floor 13 TO 15
+0.1% vs FV
Blk 605 ANG MO KIO AVE 5
Mar 2026 · Floor 07 TO 09
+0.1% vs FV
Blk 104A ANG MO KIO ST 11
Mar 2026 · Floor 01 TO 03
+9.9% vs FV
Blk 104A ANG MO KIO ST 11
Jan 2026 · Floor 01 TO 03
+10.1% vs FV
Blk 333 ANG MO KIO AVE 1
Sep 2025 · Floor 07 TO 09
-10.1% vs FV
Blk 613 ANG MO KIO AVE 4
Sep 2025 · Floor 07 TO 09
-2.7% vs FV
Blk 613 ANG MO KIO AVE 4
Sep 2025 · Floor 01 TO 03
-0.3% vs FV
HELIOS AI Analysis
The valuation of the HDB Executive property located in the highly sought-after area of Ang Mo Kio reflects a robust investment opportunity within Singapore's dynamic housing market. With a remaining lease of 88 years, this property is appraised at an estimated value of $3,744,449, translating to a price per square foot (PSF) of $704. This valuation not only positions the property above the market baseline by 10.8%, but it also signifies a noteworthy demand in a locale characterized by its strategic connectivity and established community infrastructure.
Our analysis, supported by data from 29 recent HDB resale transactions in the vicinity, reveals a high model confidence in this valuation, underscoring the resilience of the Ang Mo Kio market. The sustained interest in HDB Executive flats, particularly those with extended leases, reflects a broader trend of buyers prioritizing longevity and potential appreciation in value. As the market continues to evolve, properties like this executive flat stand out as premium assets, poised for solid capital growth in the coming years.
⚠️ Indicative estimate only. Based on URA resale transaction data. Not a formal valuation. Consult a licensed valuer for financial decisions.