HomeBuyHDB4 RoomD25 - Admiralty / WoodlandsBlk 29 Marsiling Dr4 Room (4NG) HDB for Sale in 29 Marsiling Drive
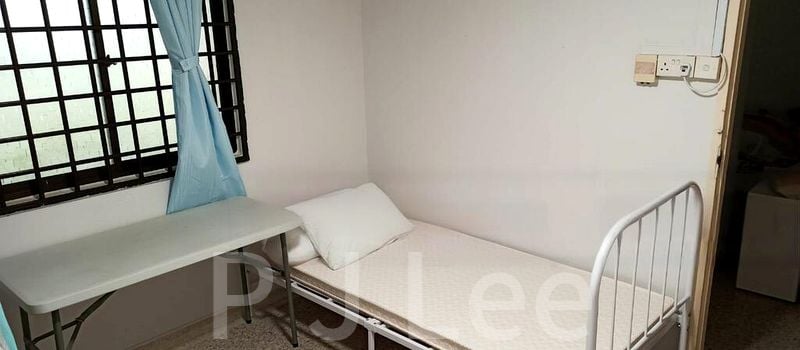
4 Room (4NG) HDB for Sale in 29 Marsiling Drive
29 Marsiling Drive 730029, North Coast, North Region, Singapore
$490,000
+5View all
IMAGES GALLERY
Property Details
Built Area1044 sqft
PSF
S$469
Year Built1977
Furnished StatusUnknown
Description
3 bedrooms + 2 bathrooms + Storeroom + Utility room Good sized living space Lift with direct access to your level Only 1 direct neighbour Easy access to Sheng Shiong Supermarket/Marsiling Lane Food Centre/Marsiling Market etc *3 months extension is needed *EIP quota as of March 2026: only for Chinese buyers **Photos have been edited. The layout of the unit remains the same.*
Location
29 Marsiling Drive 730029, North Coast, North Region, SingaporeLoading map...
Mortgage Calculation
S$
20 yrs
410203035
75 %
1020406075
4 %
0.1123456
Mortgage calculation on 4% interest rate
S$ 0
Loan Amount (75%)
Downpayment (25%)
S$ 0
S$ 0
/month
Principal
S$ 0
Interest
S$ 0
Total Transactions
0
Average Price
S0
Total Value
S0
Sales Timeline
No timeline data available
No data available
No transaction data found. This could be due to:
- No transactions in the selected radius
- Invalid date formats in transaction data
- Missing price or area information
- Current filter settings excluding all transactions

Disclaimer: The information provided on Listings.sg is for general informational purposes only. While we strive to ensure the accuracy of property listings, they are subject to change. If you notice any inaccuracies, fraudulent activity, or issues with this listing, please report it to our support team.