HomeBuyCondominiumWalk-Up3RMD03 - Alexandra / Commonwealth3 Bed Walk-up Apartment (Condo) for Sale in Tiong Bahru Estate
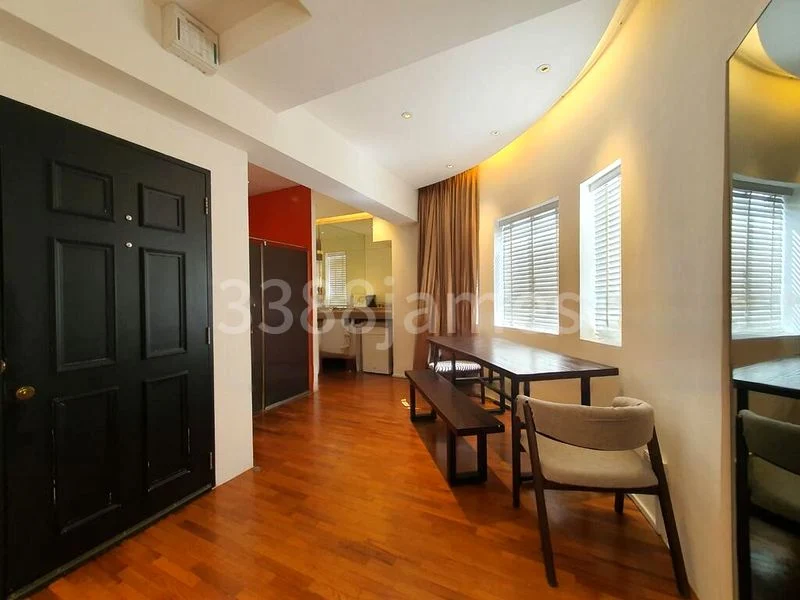
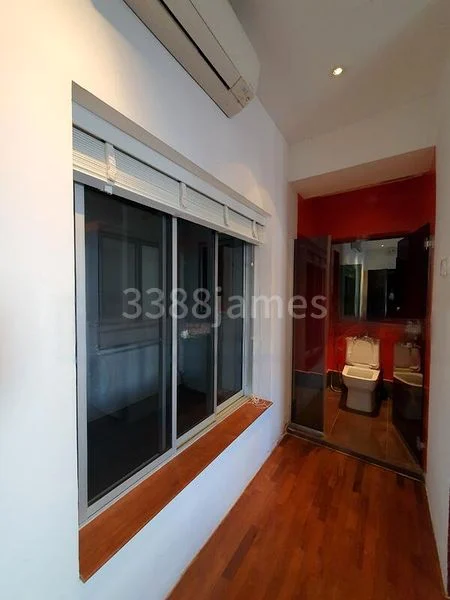
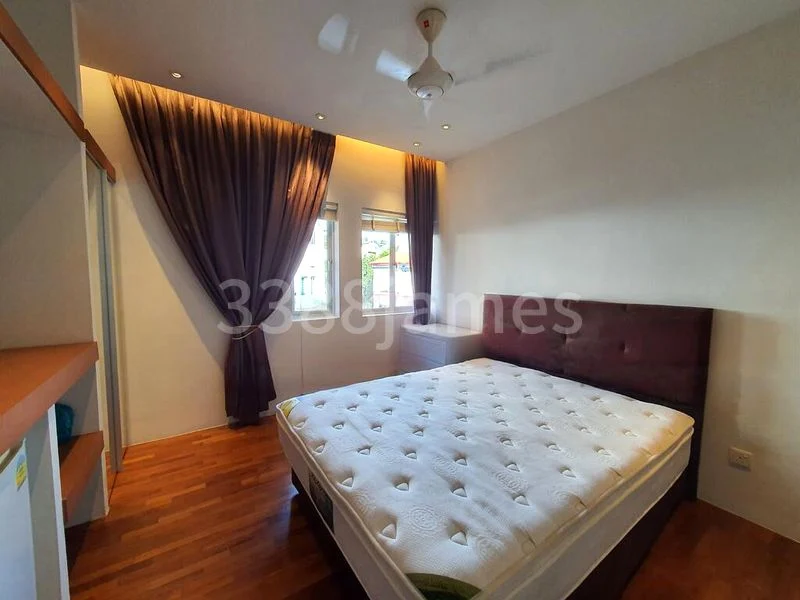
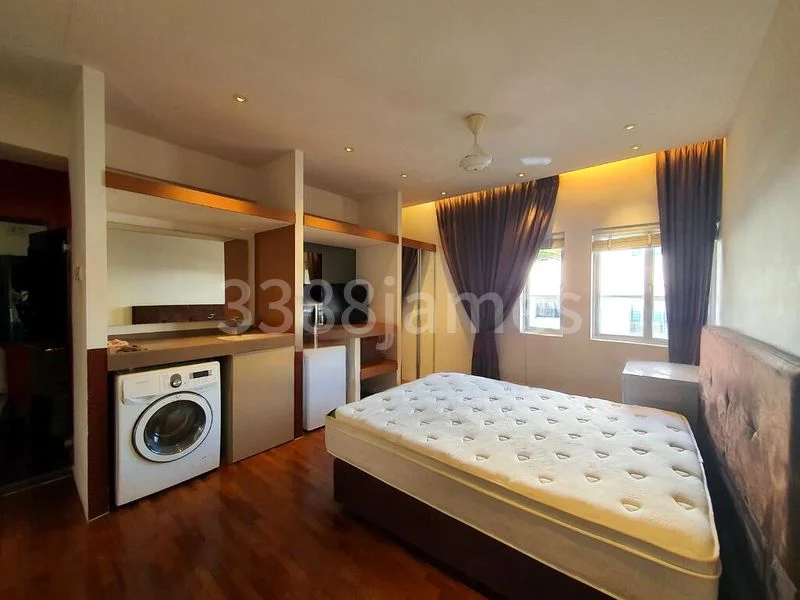
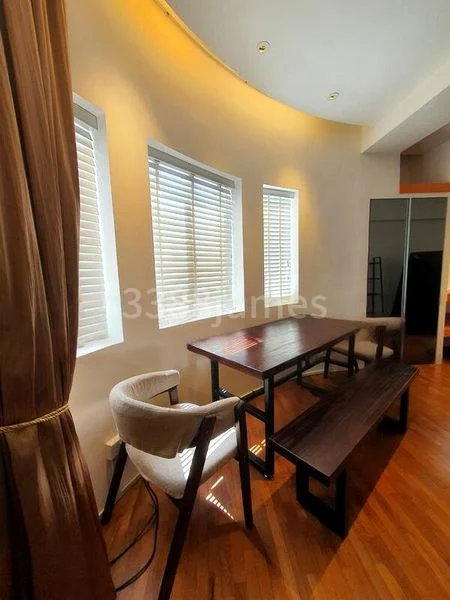
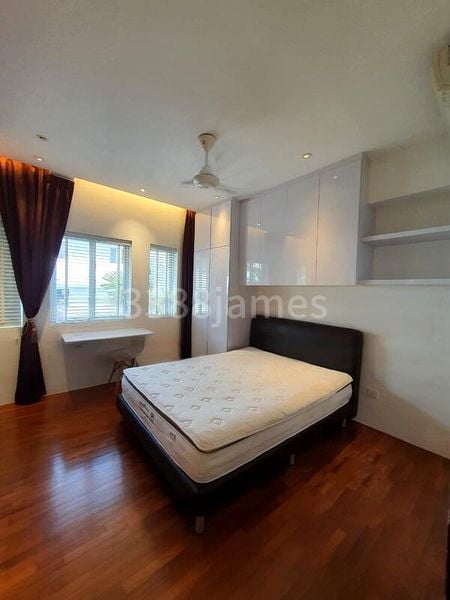
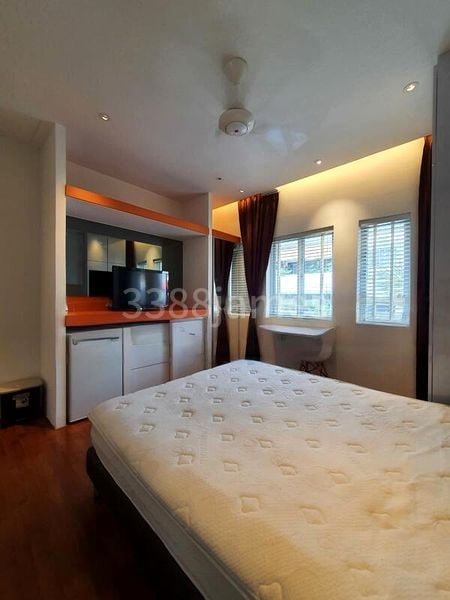
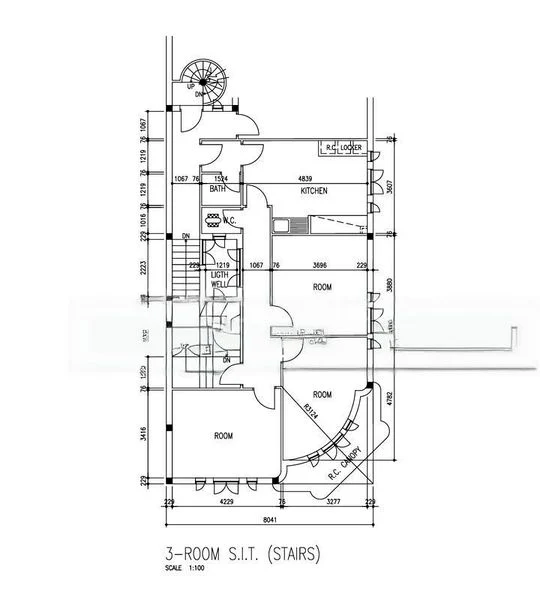
3 Bed Walk-up Apartment (Condo) for Sale in Tiong Bahru Estate
64 Tiong Poh Road 160064, Tiong Bahru, Central Region, Singapore
$980,000

+6View all
IMAGES GALLERY
Property Details
Description
Ideal for investment with excellent rental returns. Renovated and well maintained. Excellent rental returns Tenanted till June 2026. Call James 9488 XXXX for a viewing today !
Location
64 Tiong Poh Road 160064, Tiong Bahru, Central Region, SingaporeLoading map...
Mortgage Calculation
S$
20 yrs
410203035
75 %
1020406075
4 %
0.1123456
Mortgage calculation on 4% interest rate
S$ 0
Loan Amount (75%)
Downpayment (25%)
S$ 0
S$ 0
/month
Principal
S$ 0
Interest
S$ 0
Total Transactions
0
Average Price
S0
Total Value
S0
Sales Timeline
No timeline data available
No data available
No transaction data found. This could be due to:
- No transactions in the selected radius
- Invalid date formats in transaction data
- Missing price or area information
- Current filter settings excluding all transactions
Calculating fair value from URA transaction data…


Disclaimer: The information provided on Listings.sg is for general informational purposes only. While we strive to ensure the accuracy of property listings, they are subject to change. If you notice any inaccuracies, fraudulent activity, or issues with this listing, please report it to our support team.