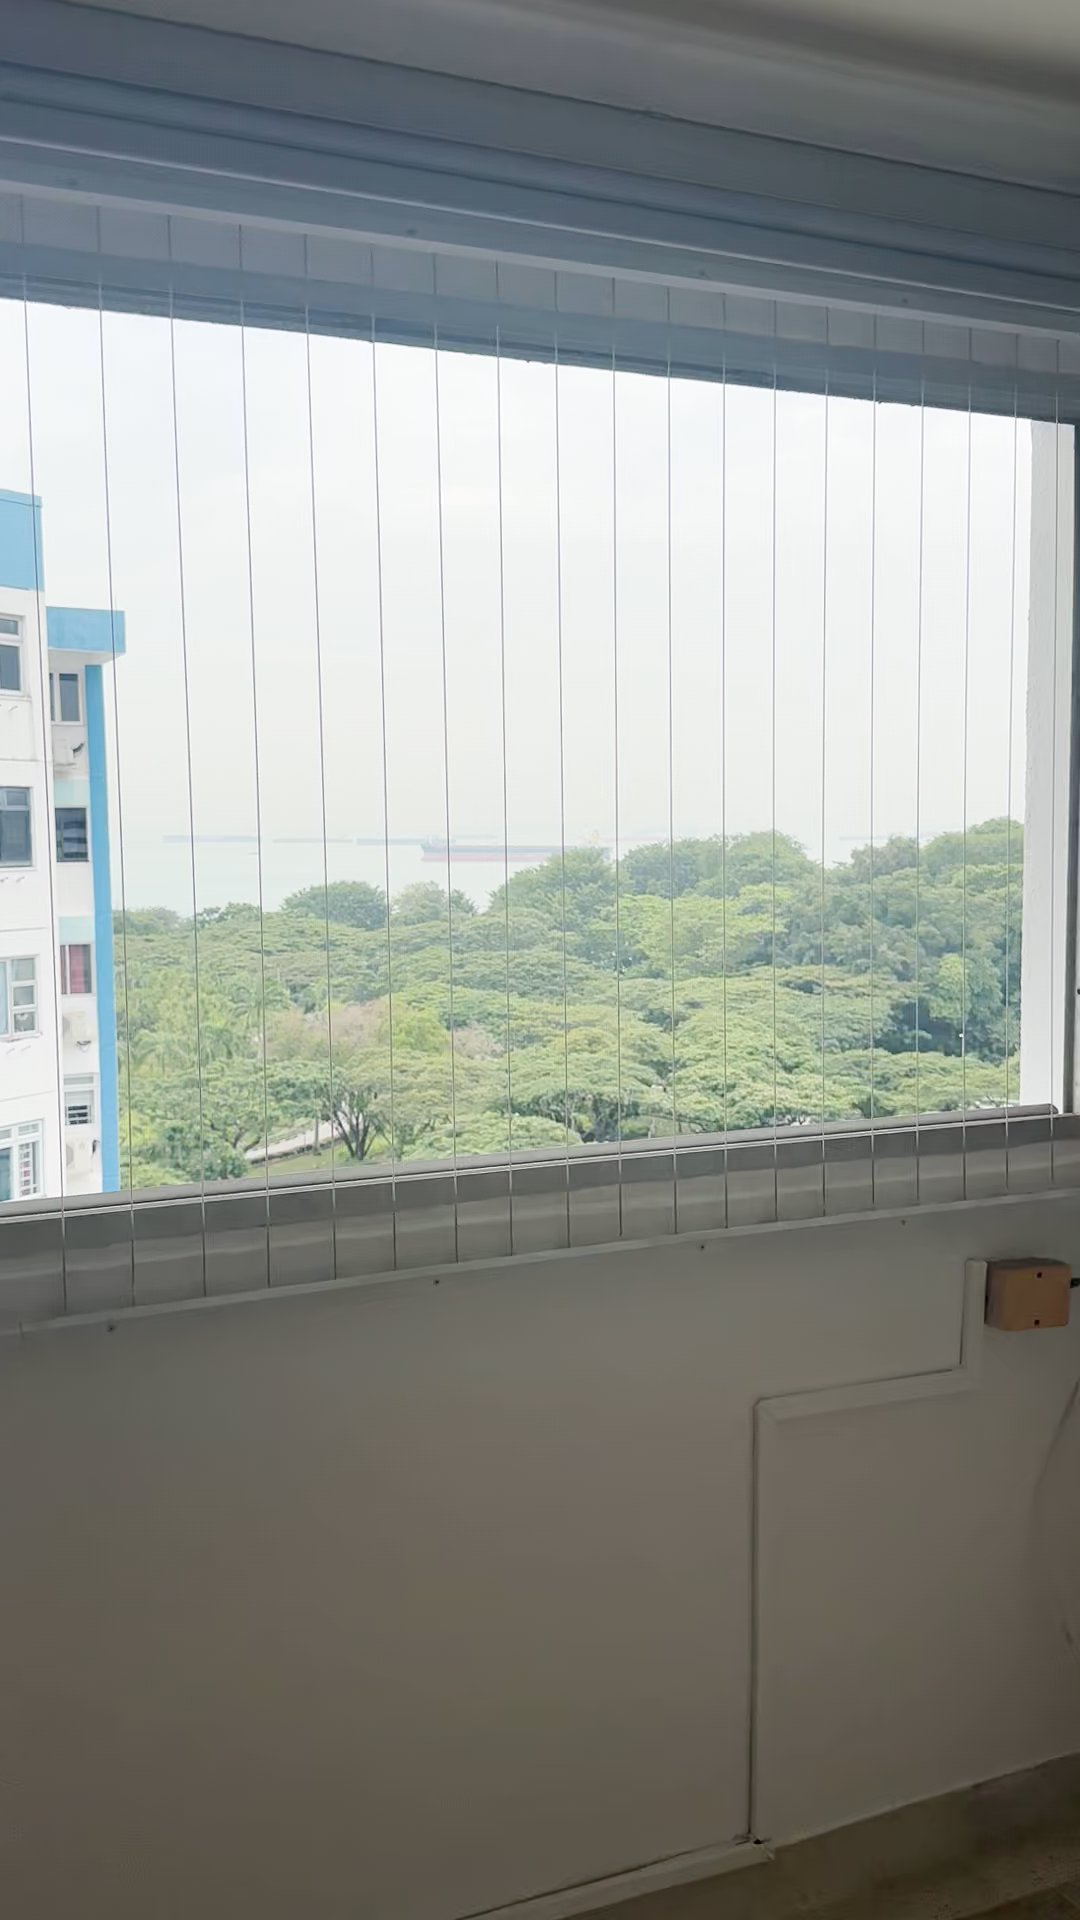
63 Marine Drive 440063, Marine Parade, Central Region, Singapore
$4,100 /month
The following locations are within radius of this property, with distance shown in kilometers.
Loading map...
Total Transactions
0
Average Price
S0
Total Value
S0
No transaction data found. This could be due to:
Calculating fair value from URA transaction data…


License: L3008899K
Estimated sale value based on 71 HDB resale transactions (data.gov.sg)
Fair Value
S$444,842
S$475 psf
Asking Price
S$4,100
S$5 psf
Listing Type
Rental
Sale value shown for reference
vs Last Done
-99.4%
Tenure
49 yrs
99-year Leasehold · ⚠️ Short lease
Confidence
High
71 comps
Nearest MRT
Eunos
2068m away
URA PSF Trendline vs Listing Price
Hedonic Adjustment Breakdown
Base URA PSF
71 comparable transactions
S$679
Floor Premium
0.5% per floor vs median
+0.0%
Tenure Decay
Bala's curve (99yr leasehold)
×0.700
MRT Proximity
Within 500m / 1km
0%
AI Condition Premium
HELIOS scan of listing description
0%
Adjusted Fair Value PSF
S$475
Recent Comparable Transactions
10 shown · 71 total| Date | Block / Street | Area | Price | PSF | Tenure |
|---|---|---|---|---|---|
Last DoneMar 2026 | Blk 17 MARINE TER Floor 13 TO 15 | 883sqft | S$710,000 | ▲S$804 +69.3% vs FV | 99yr from 1975 |
Mar 2026 | Blk 17 MARINE TER Floor 13 TO 15 | 883sqft | S$710,000 | ▲S$804 +69.3% vs FV | 99yr from 1975 |
Feb 2026 | Blk 75 MARINE DR Floor 07 TO 09 | 883sqft | S$650,000 | ▲S$736 +54.9% vs FV | 99yr from 1976 |
Feb 2026 | Blk 55 MARINE TER Floor 07 TO 09 | 947sqft | S$580,000 | ▲S$612 +28.8% vs FV | 99yr from 1975 |
Jan 2026 | Blk 45 MARINE CRES Floor 01 TO 03 | 947sqft | S$505,000 | ▲S$533 +12.2% vs FV | 99yr from 1975 |
Jan 2026 | Blk 45 MARINE CRES Floor 04 TO 06 | 947sqft | S$625,000 | ▲S$660 +38.9% vs FV | 99yr from 1975 |
Jan 2026 | Blk 75 MARINE DR Floor 04 TO 06 | 883sqft | S$675,000 | ▲S$765 +61.1% vs FV | 99yr from 1976 |
Jan 2026 | Blk 17 MARINE TER Floor 04 TO 06 | 883sqft | S$545,000 | ▲S$617 +29.9% vs FV | 99yr from 1975 |
Jan 2026 | Blk 17 MARINE TER Floor 07 TO 09 | 883sqft | S$649,909 | ▲S$736 +54.9% vs FV | 99yr from 1975 |
Jan 2026 | Blk 17 MARINE TER Floor 01 TO 03 | 883sqft | S$550,000 | ▲S$623 +31.2% vs FV | 99yr from 1975 |
Dec 2025 | Blk 75 MARINE DR Floor 01 TO 03 | 883sqft | S$640,000 | ▲S$725 +52.6% vs FV | 99yr from 1976 |
Blk 17 MARINE TER
Mar 2026 · Floor 13 TO 15
+69.3% vs FV
Blk 17 MARINE TER
Mar 2026 · Floor 13 TO 15
+69.3% vs FV
Blk 75 MARINE DR
Feb 2026 · Floor 07 TO 09
+54.9% vs FV
Blk 55 MARINE TER
Feb 2026 · Floor 07 TO 09
+28.8% vs FV
Blk 45 MARINE CRES
Jan 2026 · Floor 01 TO 03
+12.2% vs FV
Blk 45 MARINE CRES
Jan 2026 · Floor 04 TO 06
+38.9% vs FV
Blk 75 MARINE DR
Jan 2026 · Floor 04 TO 06
+61.1% vs FV
Blk 17 MARINE TER
Jan 2026 · Floor 04 TO 06
+29.9% vs FV
Blk 17 MARINE TER
Jan 2026 · Floor 07 TO 09
+54.9% vs FV
Blk 17 MARINE TER
Jan 2026 · Floor 01 TO 03
+31.2% vs FV
Blk 75 MARINE DR
Dec 2025 · Floor 01 TO 03
+52.6% vs FV
HELIOS AI Analysis
The valuation of the HDB 4-room unit in Marine Parade, with a remaining lease of 49 years, stands at an estimated value of $444,842, equating to $475 per square foot (PSF). This valuation reflects a market signal indicating a stable equilibrium, as the price shows a 0% difference from the baseline. Such stability suggests that the current demand for HDB properties in this desirable locale remains robust, despite the diminishing lease term. Marine Parade, known for its proximity to the coast and well-established amenities, continues to attract buyers, bolstering the resilience of property values in the area.
Our analysis is underpinned by a high model confidence level, supported by 71 recent HDB resale transactions in the vicinity. This substantial dataset allows for a nuanced understanding of market trends, reinforcing the valuation's credibility. As the remaining lease diminishes, it is important to monitor buyer sentiment and market dynamics, particularly in a district like Marine Parade, where lifestyle factors and accessibility play pivotal roles in property desirability. The current valuation reflects a balanced approach to pricing, indicative of a market that remains vigilant in adapting to changing lease conditions while still being driven by location appeal.
⚠️ Indicative estimate only. Based on URA resale transaction data. Not a formal valuation. Consult a licensed valuer for financial decisions.