HomeBuyLandedTerrace5RMD17 - Changi Airport / Changi Village5+1 Bed Terraced House (Landed) for Sale in Springbrook Terrace
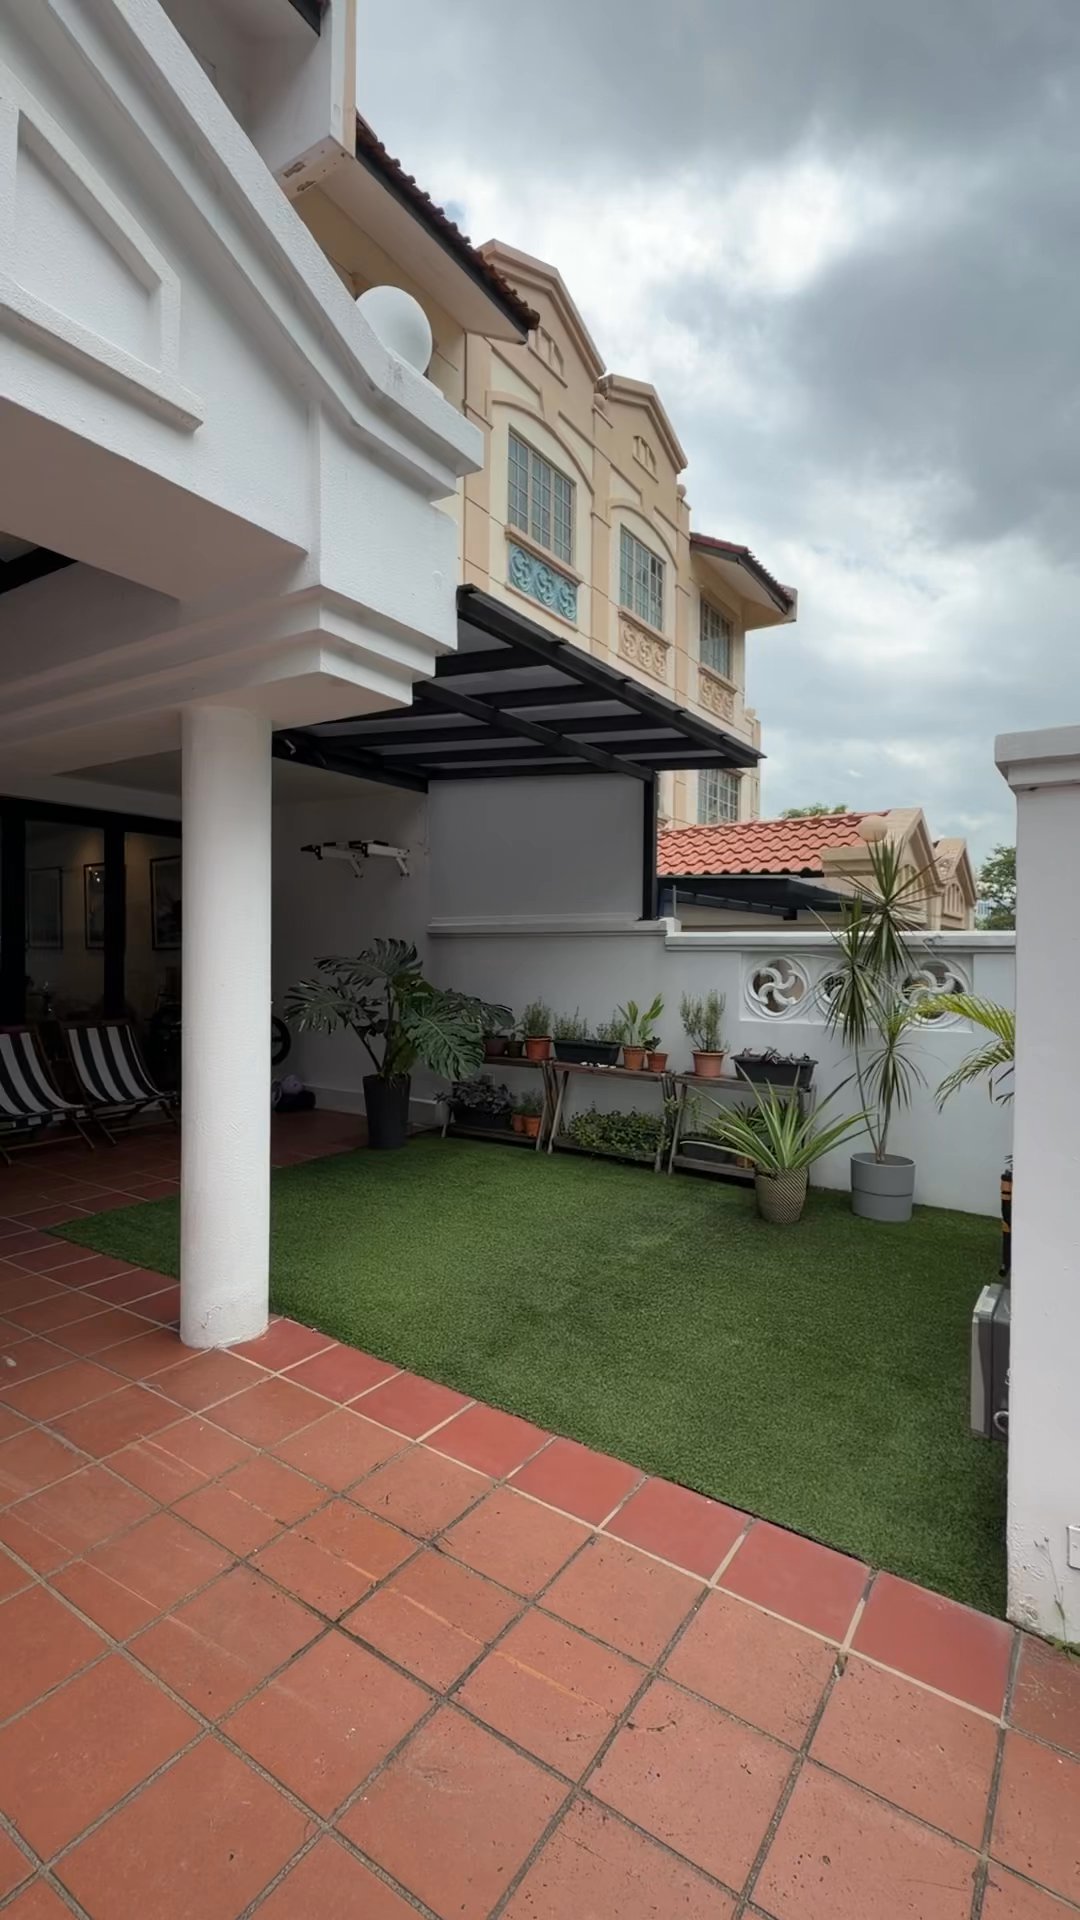
5+1 Bed Terraced House (Landed) for Sale in Springbrook Terrace
Upper Changi Road North, Flora Drive, East Region, Singapore
$4,380,000


+21View all
IMAGES GALLERY
Property Details
Property IDVu5WPvTh83STrvikw5XE2K
PriceS$4,380,000
Property TypeTerraced House
StatusFor sale
Beds5
Baths4
Built Area3880 sqft
PSF
S$2,604
Year Built1998
Furnished StatusUnknown
Description
Location
Upper Changi Road North, Flora Drive, East Region, SingaporeLoading map...
Mortgage Calculation
S$
20 yrs
410203035
75 %
1020406075
4 %
0.1123456
Mortgage calculation on 4% interest rate
S$ 0
Loan Amount (75%)
Downpayment (25%)
S$ 0
S$ 0
/month
Principal
S$ 0
Interest
S$ 0
Total Transactions
4
Average Price
S2.4M
Total Value
S9.6M
Sales Timeline
Calculating fair value from URA transaction data…


Disclaimer: The information provided on Listings.sg is for general informational purposes only. While we strive to ensure the accuracy of property listings, they are subject to change. If you notice any inaccuracies, fraudulent activity, or issues with this listing, please report it to our support team.