HomeBuyHDB3 RoomD02 - Chinatown / Tanjong PagarBlk 1 Tanjong Pagar Plaza3 Room (3I) HDB for Sale in 1 Tanjong Pagar Plaza
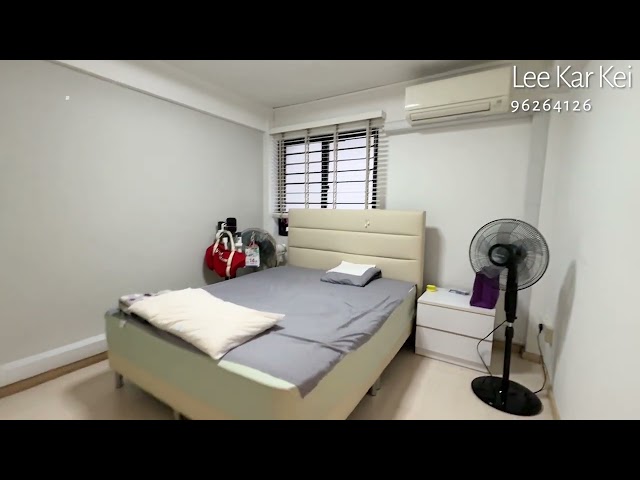
3 Room (3I) HDB for Sale in 1 Tanjong Pagar Plaza
1 Tanjong Pagar Plaza 082001, Chinatown, Central Region, Singapore
$550,000

+10View all
IMAGES GALLERY
Nearest MRT Station
Property Details
Built Area635 sqft
PSF
S$866
Year Built1977
Furnished StatusPartially furnished
Description
Features & Amenities
Renovated
Nearby Locations
The following locations are within radius of this property, with distance shown in kilometers.
Schools
MRT Stations
Location
1 Tanjong Pagar Plaza 082001, Chinatown, Central Region, SingaporeLoading map...
Mortgage Calculation
S$
20 yrs
410203035
75 %
1020406075
4 %
0.1123456
Mortgage calculation on 4% interest rate
S$ 0
Loan Amount (75%)
Downpayment (25%)
S$ 0
S$ 0
/month
Principal
S$ 0
Interest
S$ 0
Total Transactions
3
Average Price
S1.6M
Total Value
S4.9M
Sales Timeline


Disclaimer: The information provided on Listings.sg is for general informational purposes only. While we strive to ensure the accuracy of property listings, they are subject to change. If you notice any inaccuracies, fraudulent activity, or issues with this listing, please report it to our support team.