HomeBuyHDB4 RoomD25 - Admiralty / WoodlandsBlk 102 Woodlands Street 134 Room (4NG) HDB for Sale in 102 Woodlands Street 13
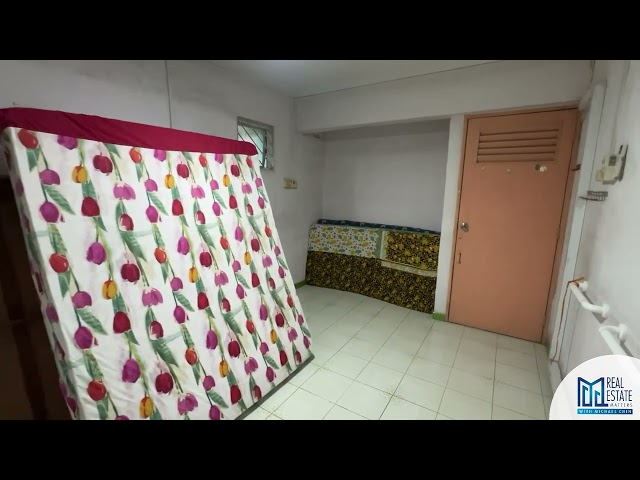
4 Room (4NG) HDB for Sale in 102 Woodlands Street 13
102 Woodlands Street 13 730102, Woodlands West, North Region, Singapore
$499,000

+11View all
IMAGES GALLERY
Property Details
Built Area990 sqft
PSF
S$504
Year Built1984
Furnished StatusUnfurnished
Description
Features & Amenities
Corner unit
Bomb shelter
Location
102 Woodlands Street 13 730102, Woodlands West, North Region, SingaporeLoading map...
Mortgage Calculation
S$
20 yrs
410203035
75 %
1020406075
4 %
0.1123456
Mortgage calculation on 4% interest rate
S$ 0
Loan Amount (75%)
Downpayment (25%)
S$ 0
S$ 0
/month
Principal
S$ 0
Interest
S$ 0
Total Transactions
0
Average Price
S0
Total Value
S0
Sales Timeline
No timeline data available
No data available
No transaction data found. This could be due to:
- No transactions in the selected radius
- Invalid date formats in transaction data
- Missing price or area information
- Current filter settings excluding all transactions


Disclaimer: The information provided on Listings.sg is for general informational purposes only. While we strive to ensure the accuracy of property listings, they are subject to change. If you notice any inaccuracies, fraudulent activity, or issues with this listing, please report it to our support team.