HomeRentLandedTerrace6RMD20 - Ang Mo Kio / Bishan / Thomson6 Bed Terraced House (Landed) for Rent in Clover Park
6 Bed Terraced House (Landed) for Rent in Clover Park
Clover Avenue, Marymount, Central Region, Singapore
$9,000 /month

+11View all
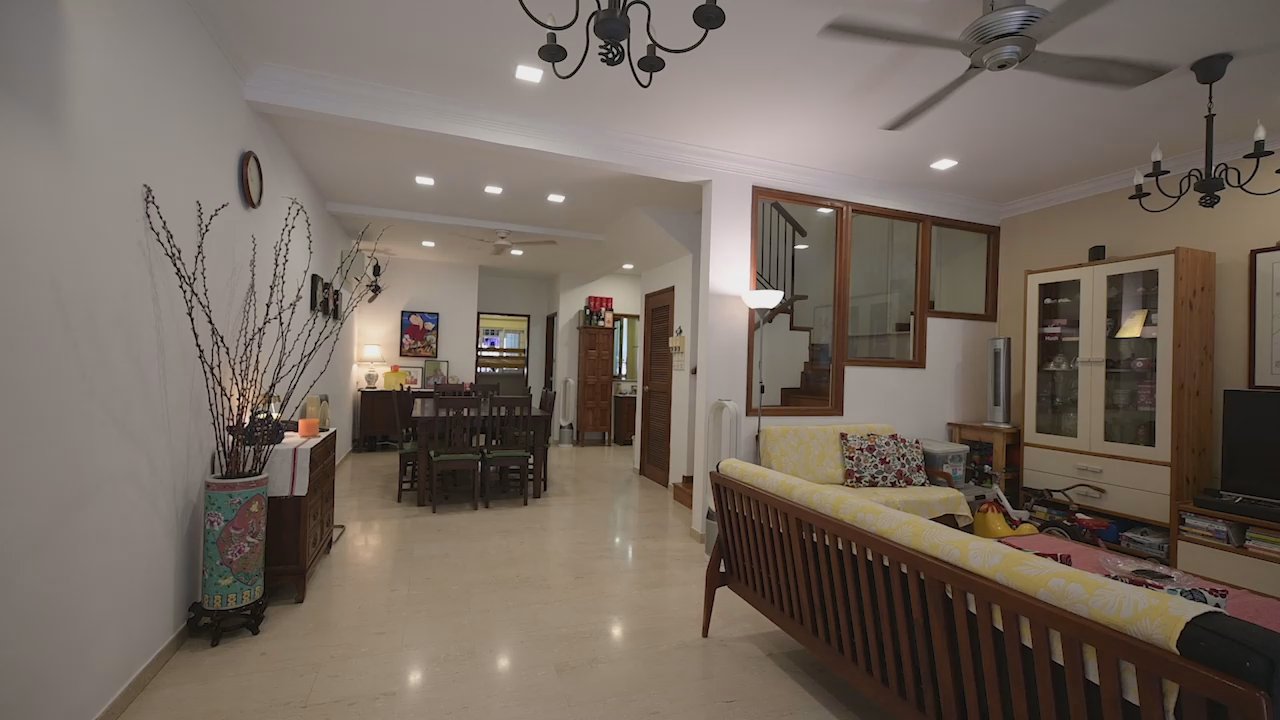
IMAGES GALLERY
Property Details
Built Area3200 sqft
PSF
S$3
Year Built1997
Furnished StatusPartially furnished
Description
Features & Amenities
Utility room
Washer
Bathtub
Fridge
Oven
Renovated
Study room
Aircon
Maid room
Location
Clover Avenue, Marymount, Central Region, SingaporeLoading map...
Total Transactions
2
Average Price
S4.0M
Total Value
S8.1M
Sales Timeline


Disclaimer: The information provided on Listings.sg is for general informational purposes only. While we strive to ensure the accuracy of property listings, they are subject to change. If you notice any inaccuracies, fraudulent activity, or issues with this listing, please report it to our support team.