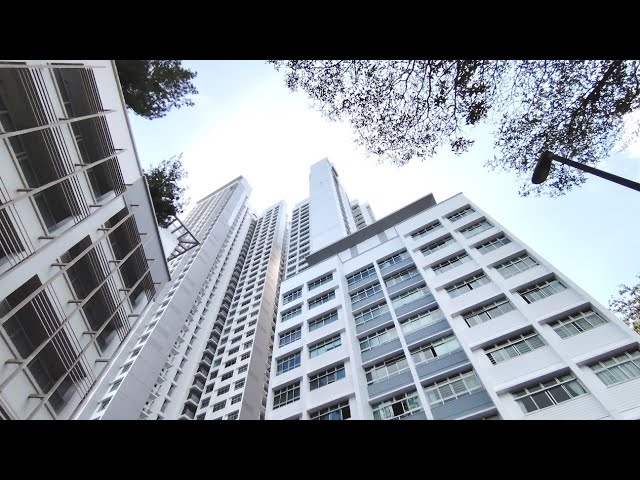
18b Holland Drive 273018, Holland Drive, Central Region, Singapore
$788,888

The following locations are within radius of this property, with distance shown in kilometers.
Loading map...
Total Transactions
0
Average Price
S0
Total Value
S0
No transaction data found. This could be due to:
Calculating fair value from URA transaction data…


License: L3008899K
Disclaimer: The information provided on Listings.sg is for general informational purposes only. While we strive to ensure the accuracy of property listings, they are subject to change. If you notice any inaccuracies, fraudulent activity, or issues with this listing, please report it to our support team.
Automated Valuation based on 150 HDB resale transactions (data.gov.sg)
Fair Value
S$602,673
S$836 psf
Asking Price
S$788,888
S$1,094 psf
vs Market
+30.9%
vs Last Done
+50.5%
Tenure
85 yrs
99-year Leasehold · Balance remaining
Confidence
High
150 comps
Nearest MRT
Buona Vista
438m away · +5% premium
URA PSF Trendline vs Listing Price
Hedonic Adjustment Breakdown
Base URA PSF
150 comparable transactions
S$758
Floor Premium
0.5% per floor vs median
+0.0%
Tenure Decay
Bala's curve (99yr leasehold)
×1.050
MRT Proximity
Within 500m / 1km
+5%
AI Condition Premium
HELIOS scan of listing description
0%
Adjusted Fair Value PSF
S$836
Recent Comparable Transactions
10 shown · 150 total| Date | Block / Street | Area | Price | PSF | Tenure |
|---|---|---|---|---|---|
Last DoneMar 2026 | Blk 28 KELANTAN RD Floor 10 TO 12 | 700sqft | S$508,888 | ▼S$727 -13.0% vs FV | 99yr from 1977 |
Mar 2026 | Blk 28 KELANTAN RD Floor 10 TO 12 | 700sqft | S$508,888 | ▼S$727 -13.0% vs FV | 99yr from 1977 |
Mar 2026 | Blk 28 KELANTAN RD Floor 07 TO 09 | 700sqft | S$455,000 | ▼S$650 -22.2% vs FV | 99yr from 1977 |
Mar 2026 | Blk 28 KELANTAN RD Floor 07 TO 09 | 797sqft | S$518,888 | ▼S$651 -22.1% vs FV | 99yr from 1977 |
Mar 2026 | Blk 271 QUEEN ST Floor 07 TO 09 | 646sqft | S$510,000 | ▼S$790 -5.5% vs FV | 99yr from 1979 |
Mar 2026 | Blk 269A QUEEN ST Floor 04 TO 06 | 721sqft | S$600,000 | ▼S$832 -0.5% vs FV | 99yr from 1984 |
Mar 2026 | Blk 1 TG PAGAR PLAZA Floor 07 TO 09 | 635sqft | S$500,000 | ▼S$787 -5.9% vs FV | 99yr from 1977 |
Mar 2026 | Blk 5 TG PAGAR PLAZA Floor 16 TO 18 | 635sqft | S$580,000 | ▲S$913 +9.2% vs FV | 99yr from 1977 |
Mar 2026 | Blk 536 UPP CROSS ST Floor 10 TO 12 | 646sqft | S$528,000 | ▼S$818 -2.2% vs FV | 99yr from 1981 |
Mar 2026 | Blk 34 UPP CROSS ST Floor 07 TO 09 | 700sqft | S$460,000 | ▼S$657 -21.4% vs FV | 99yr from 1975 |
Feb 2026 | Blk 4 TG PAGAR PLAZA Floor 10 TO 12 | 635sqft | S$515,000 | ▼S$811 -3.0% vs FV | 99yr from 1977 |
Blk 28 KELANTAN RD
Mar 2026 · Floor 10 TO 12
-13.0% vs FV
Blk 28 KELANTAN RD
Mar 2026 · Floor 10 TO 12
-13.0% vs FV
Blk 28 KELANTAN RD
Mar 2026 · Floor 07 TO 09
-22.2% vs FV
Blk 28 KELANTAN RD
Mar 2026 · Floor 07 TO 09
-22.1% vs FV
Blk 271 QUEEN ST
Mar 2026 · Floor 07 TO 09
-5.5% vs FV
Blk 269A QUEEN ST
Mar 2026 · Floor 04 TO 06
-0.5% vs FV
Blk 1 TG PAGAR PLAZA
Mar 2026 · Floor 07 TO 09
-5.9% vs FV
Blk 5 TG PAGAR PLAZA
Mar 2026 · Floor 16 TO 18
+9.2% vs FV
Blk 536 UPP CROSS ST
Mar 2026 · Floor 10 TO 12
-2.2% vs FV
Blk 34 UPP CROSS ST
Mar 2026 · Floor 07 TO 09
-21.4% vs FV
Blk 4 TG PAGAR PLAZA
Feb 2026 · Floor 10 TO 12
-3.0% vs FV
HELIOS AI Analysis
The valuation for the HDB 3 Room property located in the Central Area is estimated at $602,673, translating to a robust $836 PSF. This valuation reflects a significant appreciation in the property’s market dynamics, with a notable 30.9% premium above the established market baseline. Such a valuation places this unit firmly in the upper echelons of the market, driven primarily by its strategic location and the remaining lease of 85 years, which offers prospective buyers considerable longevity and stability.
This analysis is supported by a comprehensive examination of 150 recent HDB resale transactions within the vicinity, indicating a strong demand for properties in this area. The high model confidence level further reinforces the reliability of this valuation, suggesting that the property not only retains its value but also has the potential for further appreciation. The interplay between the diminishing lease term and the vibrant market signals a compelling opportunity for investors and homeowners alike, particularly in a landscape where central locations continue to command premium prices.
⚠️ Indicative estimate only. Based on URA resale transaction data. Not a formal valuation. Consult a licensed valuer for financial decisions.