HomeBuyHDB3 RoomD20 - Ang Mo Kio / Bishan / ThomsonBlk 119 Ang Mo Kio Ave 33 Room (3NG) HDB for Sale in 119 Ang Mo Kio Avenue 3
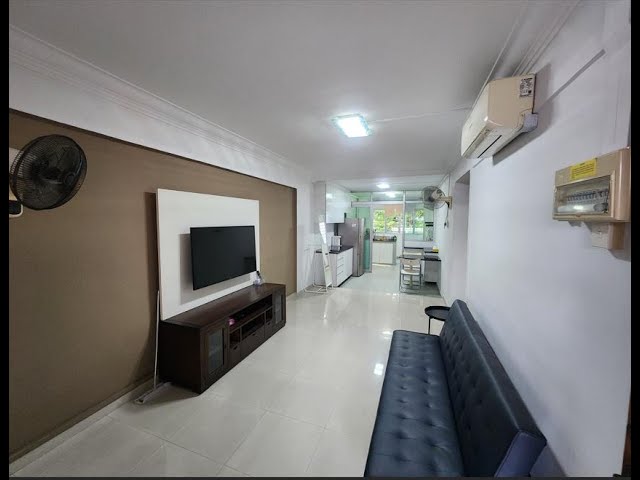
3 Room (3NG) HDB for Sale in 119 Ang Mo Kio Avenue 3
119 Ang Mo Kio Avenue 3 560119, Kebun Bahru, North-east Region, Singapore
$480,000

+6View all
IMAGES GALLERY
Nearest MRT Station
Property Details
Built Area721 sqft
PSF
S$666
Year Built1977
Furnished StatusPartially furnished
Description
Features & Amenities
Renovated
Nearby Locations
The following locations are within radius of this property, with distance shown in kilometers.
MRT Stations
Location
119 Ang Mo Kio Avenue 3 560119, Kebun Bahru, North-east Region, SingaporeLoading map...
Mortgage Calculation
S$
20 yrs
410203035
75 %
1020406075
4 %
0.1123456
Mortgage calculation on 4% interest rate
S$ 0
Loan Amount (75%)
Downpayment (25%)
S$ 0
S$ 0
/month
Principal
S$ 0
Interest
S$ 0
Total Transactions
0
Average Price
S0
Total Value
S0
Sales Timeline
No timeline data available
No data available
No transaction data found. This could be due to:
- No transactions in the selected radius
- Invalid date formats in transaction data
- Missing price or area information
- Current filter settings excluding all transactions


Disclaimer: The information provided on Listings.sg is for general informational purposes only. While we strive to ensure the accuracy of property listings, they are subject to change. If you notice any inaccuracies, fraudulent activity, or issues with this listing, please report it to our support team.